
On 14 January 2020 Ofsted released data regarding its latest judgements as of 31 December 2019.
Now that 4 months have passed since the introduction of the new Ofsted Inspection Framework, there are sufficient schools to do a meaningful analysis of trends under this new framework.
There is a correlation between deprivation and attainment but is there one between deprivation and Ofsted’s judgements, and has it changed from previous years?
This article will use the IDACI measure as a measurement of deprivation and consider Ofsted’s Full Inspections only. We have considered those inspections which resulted in an Overall Effectiveness judgement of Outstanding, Good, Requires Improvement or Inadequate, for Primary and Secondary schools. More details are at the bottom of this article.
Overall Effectiveness
Firstly, for these 619 schools, what is Ofsted’s Overall Effectiveness judgement? The full details are in the table below:
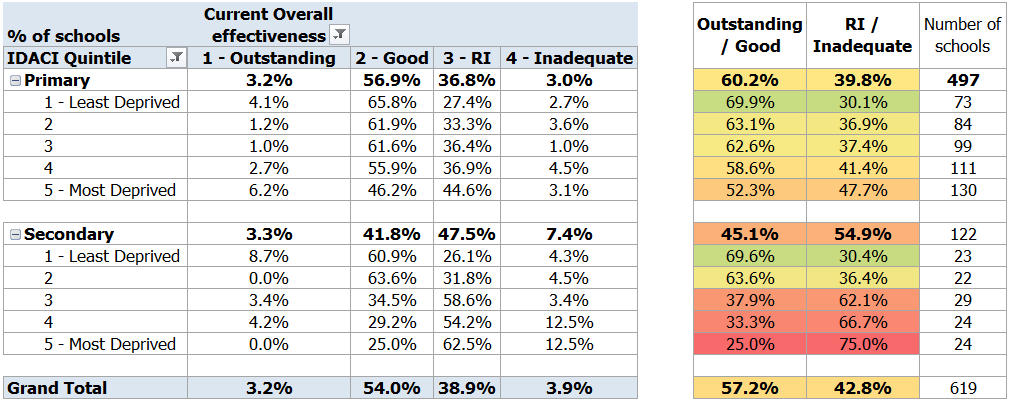
In headline terms, for primary schools, the chances of getting an Outstanding/Good judgement is 60%, whereas for secondary schools it is 45%.
There is a correlation between Deprivation and Requires Improvement/Inadequate.
For Primary Schools,
- 70% of the least deprived schools get an Outstanding/Good judgement,
- whereas only 52% of the most deprived schools get this rating.
- This is a gap of 18%.
For Secondary Schools
- 70% of the least deprived schools get an Outstanding/Good judgement,
- whereas only 25% of the most deprived schools get this rating.
- This is a gap of 45%.
Has this changed?
However, how different is this from what Ofsted has been doing in the past?
Here is the same analysis of these schools, but using their Previous Overall Effectiveness judgement:
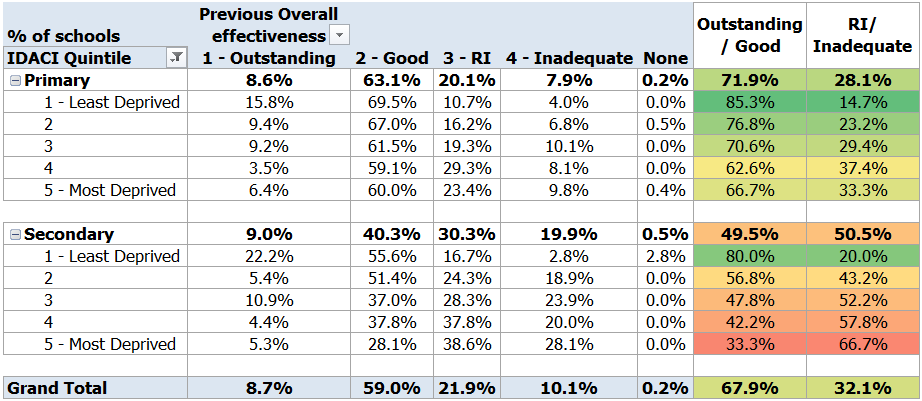
It is noticeable that the Overall Effectiveness was much higher in their previous judgements.
For Primary schools, 72% of these schools used to have an Outstanding/Good judgement – that is now down to 60%, down 12%.
For Secondary schools, 50% of these schools used to have an Outstanding/Good judgement – this is now down to 45%, down 5%.
There previously was a difference in Ofsted Judgements based on the pupils’ deprivation.
For primary schools,
- 85% of the least deprived schools get an Outstanding/Good judgement (this is now 70%),
- whereas only 67% of the most deprived schools get this rating (this is now 52%).
For secondary schools
- 80% of the least deprived schools get an Outstanding/Good judgement (this is now 70%),
- whereas only 33% of the most deprived schools get this rating (this is now 8%).
IDACI
So it appears that the new Inspection Framework has most adversely affected Primary schools than Secondary schools. But what is the difference in the different IDACI levels?
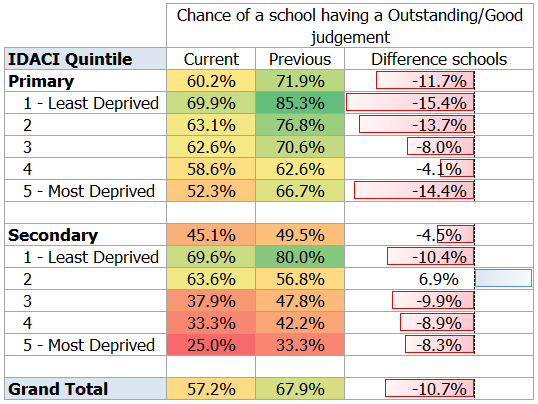
For primary schools…
For the least deprived schools in this sample, the percentage of good schools has gone down by 15%. This is similar to the next quintile and for the most deprived schools.
For secondary schools…
the percentage of outstanding/good schools in almost all quintiles have gone down by 8%-10%.
So it may appear that all quintiles have gone down roughly similarly (with a few exceptions).
However:
For primary schools in this sample..
for every 1 good/outstanding school in the most deprived areas, there was 1.27 schools in the least deprived areas – now, that figure has increased to 1.34.
For secondary schools in this sample..
For every 1 good/outstanding school in the most deprived areas, there was 2.40 schools in the least deprived areas – now, that figure has increased to 2.78.
It will be interesting to revisit this analysis with additional Ofsted judgements.
For now, it appears that:
The chance of getting an Outstanding/Good judgement has largely decreased across the board.
There already was a disparity between the various quintiles of deprivation – the fact that it has not widened does not remove it.
Methodology
This article has considered those inspections which were understanding and published in the period 1 September 2019 and 31 December 2019 which resulted in an Overall Effectiveness judgement of Outstanding, Good, Requires Improvement or Inadequate, for Primary and Secondary schools.
This is shown in the Ofsted’s Management Information as of 31 December 2019, using the spreadsheet “All inspections 2019-20”, where column B (Ofsted phase) is Primary or Secondary, and where column Z “Overall effectiveness” is 1, 2, 3 or 4 (i.e. is not 9).
- This largely excludes inspections of already good schools under Section 8 which don’t convert into a full Section 5 inspection, as these judgements are narrative and don’t result in an Overall Effectiveness judgement.
- It also excludes Monitoring visits of Requires Improvement and Inadequate schools under Section 8, which also do not result in an Overall Effectiveness judgement.
- It also excludes Nursery, PRUs and Special Schools, as there have been too few inspections to make a meaningful sample.

DAISI Education
Thank you for reading this article.
- Marginal Gains
- Never Stop Learning
- Learning Loss
- Has Ofsted really gone off School Data?
- Ofsted Deep Dives
- Ofsted’s concerns regarding Curriculum Design
- What will Ofsted Inspections look like in your school?
Find other Blog articles by clicking here
Check out more about how we can help your school: Primary | Secondary
Brilliant!
Thanks Ross. Please do share.
Brilliant!
Really interesting analysis
Worth sharing this more widely. Ofsted Take note please
This is rather worrying. How is this possible. Thank you for highlighting this.
Thank you DAISI for making this clear. Worrying indeed