
Absence and Exclusions
Quick Links
You can download this guide as an easy to read pdf booklet by clicking HERE
Attendance
All schools meet for at least 380 sessions, one in the morning and one in the afternoon. In each sessions, schools record whether pupils are:
- Present,
- Attending an approved education activity,
- Unable to attend due to exceptional circumstances, or
- Absent.
If a pupil is absent, schools need to ascertain the reason and ensure that proper safeguarding action is taken if needed. Reasons that a pupil can be absent include:
Authorised absence due to
- Medical/dental appointments,
- Religious observances,
- Study leave,
- Gypsy, Roma and Traveller absence.
Unauthorised absence due to
- Family holiday,
- Late,
- Not yet known, and
- Other.
Absence Measures
Three times a year, the DfE publishes data for absence and persistent absence.
A pupil’s absence is calculated as the number of sessions where a pupil is absent, divided by the number of sessions available to that pupil.
Overall Absence
A school’s absence rate is the average of the absence rates of all pupils who are of compulsory school age (aged between 5 and 15 as of the previous 31 August).
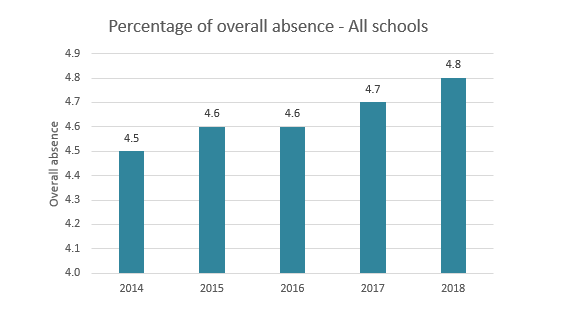
National Average: Overall absence levels (Primary 4%, Secondary 5.5%).
Persistent Absence
A pupil is persistently absent if that pupil misses 10% or more of all available sessions.
A school’s persistent absence rate is the total number of persistently absent pupils of compulsory school age, divided by the number of compulsory school age pupils in the school. For this calculation, it doesn’t matter whether a pupil missed 10% of all available sessions or 30%; that pupil has the same weighting.
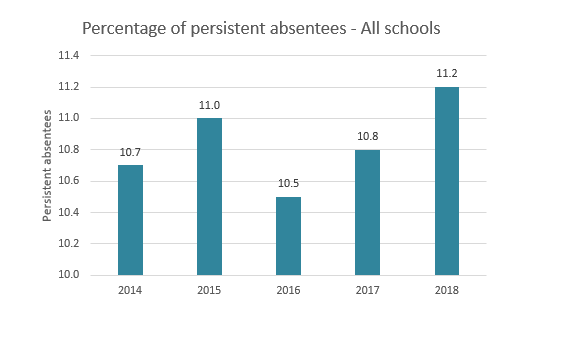
National Average: Persistent absence levels (Primary 9%, Secondary 11%).
Other Measures
The DfE publishes other measures for schools, Local Authorities (LAs) and Nationally.
These are shown below with approximate National averages:
- Authorised absence levels (Primary 3%, Secondary 4%),
- Unauthorised absence levels (Primary 1%, Secondary 1.5%),
- Absence levels by reason (e.g. Illness 2.5%)
The DfE publishes their Absence analysis on the public gov.uk website:
- For the autumn term in May,
- For the autumn and spring terms in October, and
- For the full academic year in the following March.
Any small figures in an individual school’s statistics are supressed on the public gov.uk website.
The ASP service and IDSR
The Analyse School Performance (ASP) service and Ofsted’s Inspection Data Summary Report is updated with the autumn and spring term absence analysis in December, and with the full academic year absence figures in May.
These are only accessible to schools, Local Authorities and Ofsted – who use them to prepare for school inspections.
In the IDSR, in terms of absence:
- Ofsted compare the overall rate of absence with the National average for schools which have a similar level of deprivation (as measured by IDACI).
- Ofsted comment when boys, girls, FSM, EAL and SEN pupils are 10% above the cohort National average.
- Ofsted also comment when the overall absence rates is in the highest or lowest 10% for at least 2 years.

Our ASaP report makes the ASP easy with detailed written statements, graphs and charts. With Personalised Insight on every page, our time saving analysis includes detailed insight into your many different cohort groups. Click here for more
Exclusion Reasons
The DfE publishes per-school details of the number of pupils excluded in each calendar year. In this context, “exclusions” does not include lunch-time exclusions.
Pupils are either fixed-term excluded (suspensions) or are permanently excluded (expulsions) principally for the following reasons:
- Persistent disruptive behaviour,
- Physical assault against an adult,
- Physical assault against a pupil,
- Verbal assault against an adult, and
- Other.
Additional less-common reasons include:
- Bullying,
- Damage,
- Drug and alcohol related,
- Racist abuse,
- Sexual misconduct,
- Theft, and
- Verbal assault against a pupil.
Exclusion Measures
The following measures are released by the DfE on the gov.uk website in July/August:
- Number of permanent exclusions (expulsions).
- Number of fixed period exclusions (suspensions).
- Number of pupils with one or more fixed period exclusions.
In addition, the ASP service and Ofsted’s IDSR is updated in November, and has the additional measure:
- Number of pupils with two or more fixed period exclusions (“Repeat” suspensions).
The data that is released is a year in arrears (e.g. the 2017/18 data will be released in July/August 2019 on the gov.uk website and in November 2019).
These measures are released as:
- the number of exclusions, and
- a percentage, which is the number of exclusions divided by the number of pupils in January.
Exclusion in Ofsted’s IDSR
In the IDSR, Ofsted looks at the following:
- a comparison of the total fixed-term exclusions compared with the national average for schools with a similar level of deprivation (as measured by IDACI).
- whether all the fixed-term exclusions are for specific groups (gender, FSM, EAL or SEN).
- whether the rate of fixed-term exclusions was at least 10% above the national comparator.
- whether the rate of total or repeat fixed was above the national average for the last 3 weeks.

Our online ASP and IDSR training courses includes several videos about interpreting absence and exclusion data, together with more details about Ofsted’s interpretation of these figures, and Points to Ponder.

“Understanding Your School Data” Guides
Thank you for reading our data guide – we hope you found it helpful.
You can download this guide as an easy to read pdf booklet by clicking HERE
Click here to return to our Guides homepage