Introducing… QLA Results
Your full order will include 5 attachments.
- Full Summary Report
- 3 Subject Reports – Maths, Reading, GPS
- Full set of Individual Pupil Profiles
In each report, we present detailed analysis by
Summary | Topic | Question | Pupil | Cohort
Summary
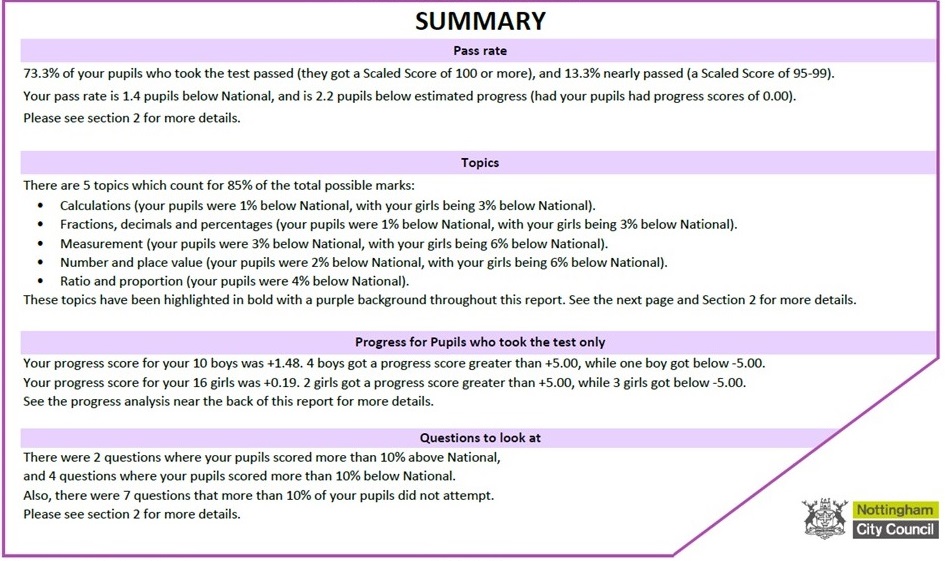
Whatever assessment you use, you have to start with taking an overall view (for example, how many pupils passed or nearly passed), but also at the important topic strands, seeing how the school is doing, and “producing clear next steps for pupils”.
This analysis provides a clear starting point, focusing on key headlines and areas for deeper analysis.
“Thank you ever so much for the QLA reports & the subsequent updates. The service we have received from yourselves & the attention to detail have been fantastic. We have found the reports to be incredibly useful & they are helping us to shape our school improvement priorities for the coming year.”
Headteacher, Holy Trinity CE Junior School, Ripon
BACK TO TOP | PDF Download | Group Orders | How to use our Analysis
Detailed Analysis by Summary | Topic | Question | Pupil | Cohort
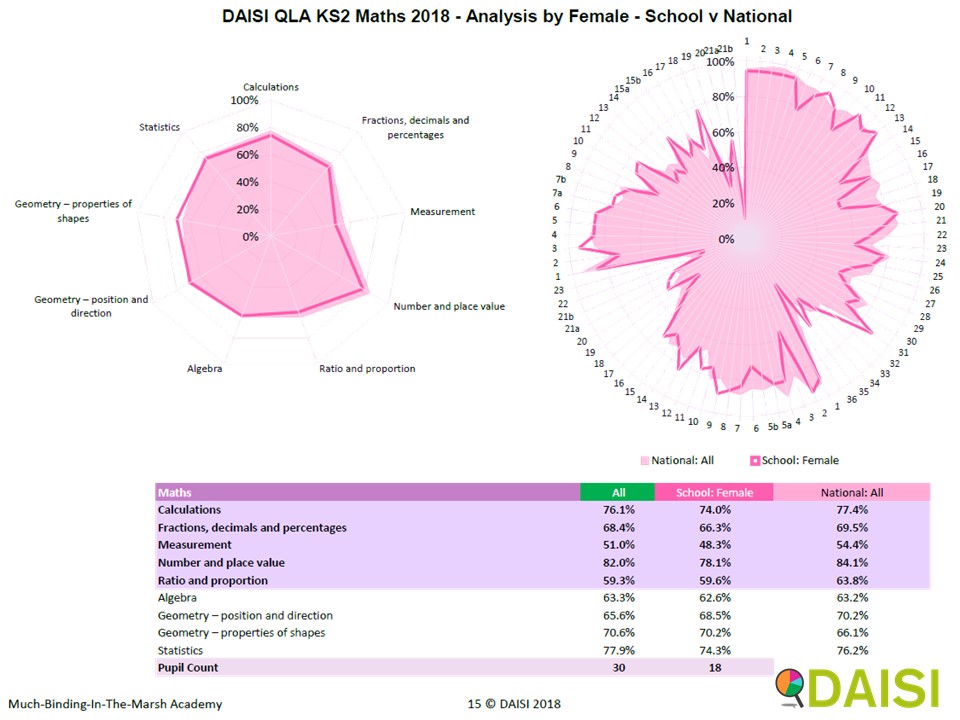
Topic by Topic
Question Level Analysis looking at topics or cohorts rather than individual answers. This aggregation allows you to see patterns emerging which can be the drivers to implement change.
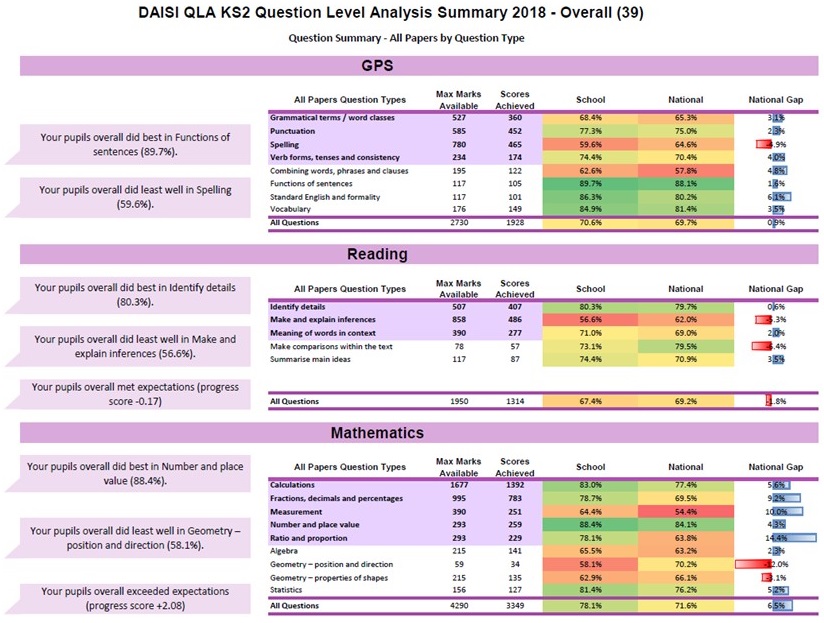
Our Topic Insight enables teachers to create tailored lesson plans to address learning gaps on certain areas from the start of the year.
This page shows strengths and weaknesses for all pupils, comparing boys and girls, the entire year, and national averages. For example:
- Girls excelled in ‘Ratio and proportion,’ while boys did not.
- Boys performed well in the first four topics, whereas girls did not.
This analysis allows you to look at your subject as a whole to see what teaching could be improved and implement targeted interventions for groups that need additional support.
“I think they are a great tool and really help us to analyse our data in great detail. I have been telling everyone how good they are & how they have saved hours of work. This has allowed me to focus on how we can improve teaching and learning rather than spending time on the data analysis – a very welcome change.”
Headteacher, Captain Cook Primary School, Middlesbrough (James Cook Learning Trust)
BACK TO TOP | PDF Download | Group Orders | How to use our Analysis
Detailed Analysis by Summary | Topic | Question | Pupil | Cohort
Question by Question
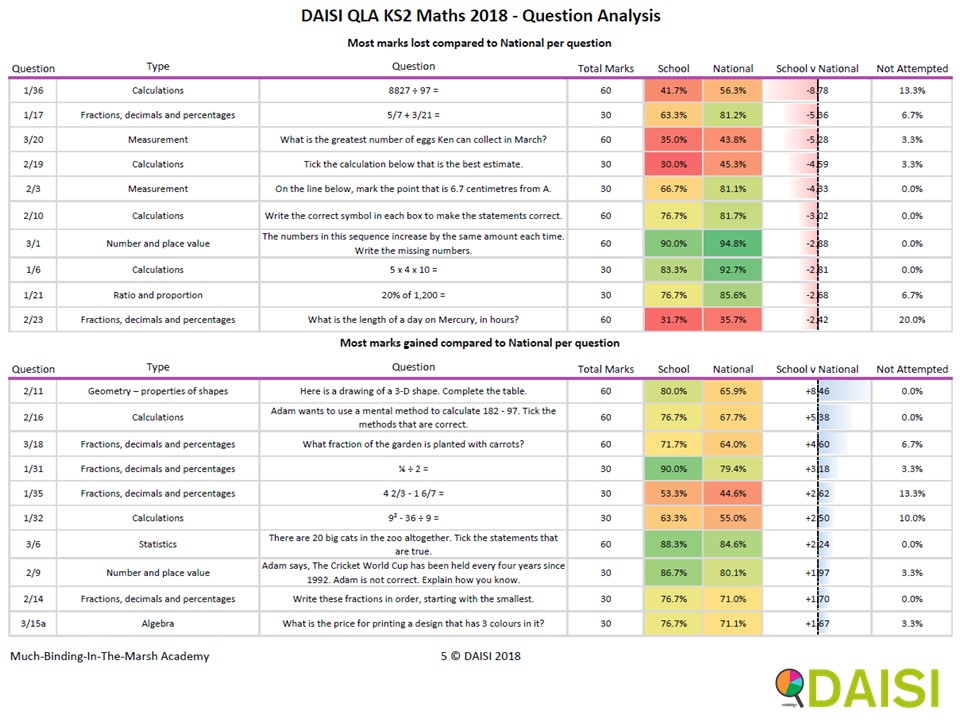
This analysis has been designed to help teachers identify questions that pupils found difficult or easier than average. For example, 8827 divided by 97 might be a common problem, highlighting issues with approximation.
It also shows areas where pupils outperform national averages, which can be extended for advanced students or allow time to focus on other topics.
This analysis can be used as evidence to update your curriculum to include more practice and instruction in areas where pupils struggle or indeed more advanced topics for areas where pupils excel.
“These reports are so thorough and useful. Subject leaders and Raising Standards Leaders in each primary school are going to be able to use this information to inform teaching and learning opportunities , not just in Year 6, but across the school!”
Headteacher, Ravensthorpe Primary School (Peterborough Keys Trust)
BACK TO TOP | PDF Download | Group Orders | How to use our Analysis
Detailed Analysis by Summary | Topic | Question | Pupil | Cohort
Pupil by Pupil
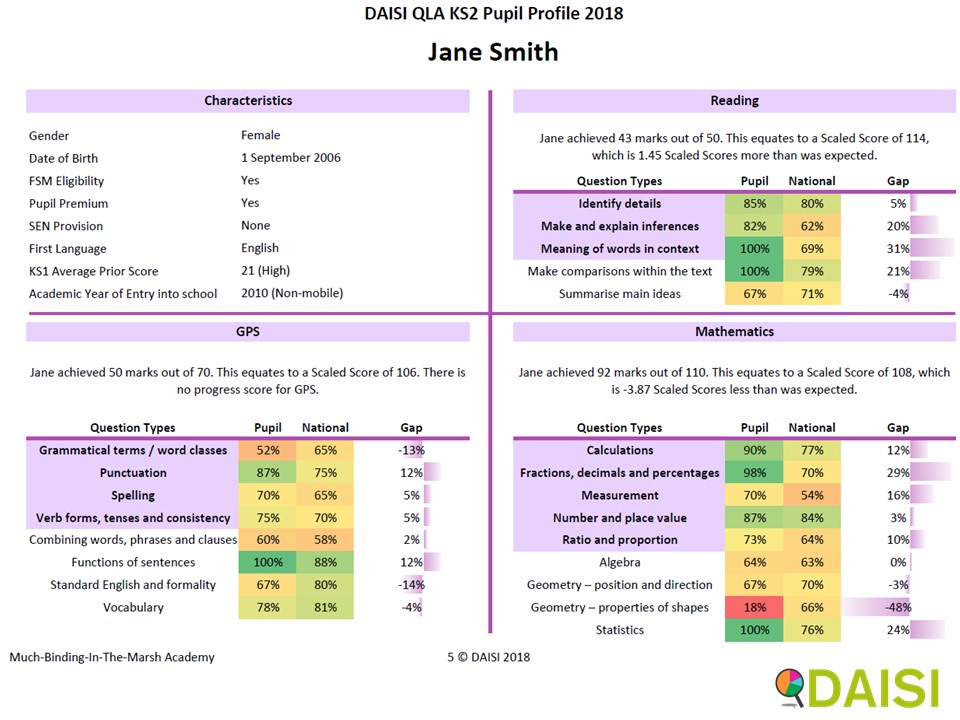
Our Individual pupil profiles enable you to look at individual pupils and see how they performed.
For example, Jane performed 12% better than the National Average for Punctuation, but is 13% below for Grammatical terms and word classes. With that knowledge, you might want to investigate why that was the case.
Try looking at other pupils. Does a pattern emerge? Could this be an area for future focus?
This analysis gives clear guidance of where marks were lost and gained but also provides detailed evidence to help guide your search for improvements across the school.
“In regards to the QLA as we have such a large cohort – it is good to look for areas/types of questions where children have struggled and we need to focus on further in the future. The QLA for each individual child is useful when looking at specific children within groups SEN, FSM, PP looking particularly at their individual progress in each subject.”
Headteacher, Fernwood Primary School, Nottingham
BACK TO TOP | PDF Download | Group Orders | How to use our Analysis
Detailed Analysis by Summary | Topic | Question | Pupil | Cohort
Cohort by Cohort
For a full analysis of your results, you will need to look more than at your school overall or the overall score per pupil. By looking in detail at your various cohorts, you can see a more collective and forensic picture emerging. This is where the true power of QLA to change your school lies.
We break the results down in your various cohorts – gender, disadvantaged, SEN, EAL and prior attainment. This analysis is very powerful when looking back to find areas for school improvement.
For example, maybe when you look at your girls, you find that fractions are currently a problem, as evidenced by the results of certain questions compared with the National Average, and compared with your boys’ answers to the same question.
This analysis helps you focus on different cohorts within your year group and address areas in need. Small changes to specific cohorts can significantly improve school results. When these changes are embedded in school improvement planning, they can make a substantial difference.
“We struggled historically with reading results at the end of KS2 and have used DAISI QLA to drill down into the reasons why reading was significantly lower than maths. Using QLA we found that the issues were EAL pupils struggling with vocabulary -we introduced word of the week, then realising we needed more, word of the day. We also put on additional pre teaching sessions with an EAL teacher. We also identified that inference was a massive problem and we made it our whole school target, had loads of CPD and this made a massive difference.
In 2016, our reading EXP was 54%. In 2017, it was 68% and in 2018, it was 79%. All down to QLA.“
Deputy Headteacher, Seely Primary & Nursery School, Nottingham
Order QLA Results now..
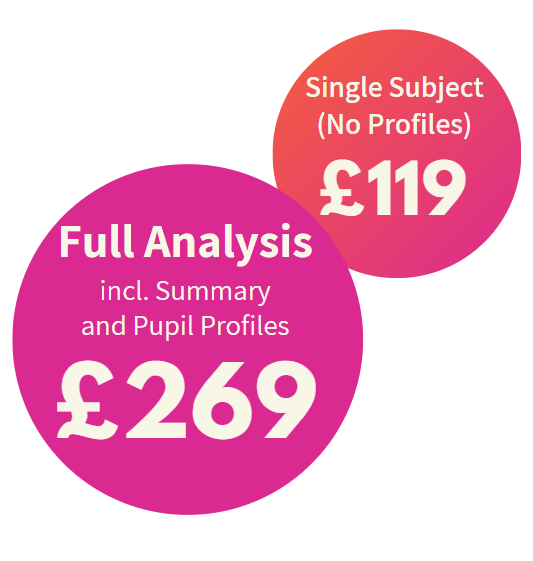
Full Price: £269 | £119 – Individual Subject only..
Premium Price for Subscribers: Only £239
Click here to order your 2025 Analysis today
After ordering, you’ll receive an email with full instructions.
Once the data is available…
- Download Data: Follow these instructions and to download data from your school’s ASP online account. It should take about 5-10 minutes.
- Send it to DAISI: Please send the data via encrypted transfer. We recommended using S2S.
- Receive Reports: Within days, you’ll receive detailed reports directly in your inbox, including individual pupil profiles and summary analysis. We aim to send all analysis back within 3 working days from provision of data.

Sign up to our Mailing List and get the premium price…
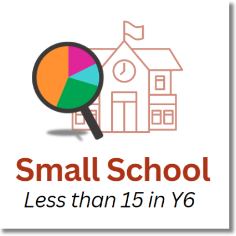
Does your school have less than 15 pupils in Year 6?

Order as a group and receive a FREE summary report plus a discounted rate

Our Primary Data Packages include QLA Results plus so much more.