Did you know the full breakdown of your KS2 SATs results is available every year?
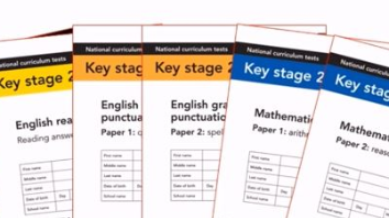
The KS2 SATs give a validated indication of each of your students strengths and weaknesses and the results are made available every year by the DfE – broken down to performance in each individual question via analyse school performance.
These are standardised assessments – marked independently – and so give a great overview of your school curriculum and how successfully it guided your Year 6 to achieve their potential.
Or more importantly, it can provide the keys to unlock your curriculum and raise attainment across your school for many years to come… and yet, so many schools simply do not use this resource even though it is free and easy to download!!
But this is data from the past…
We agree but by looking back at how your full Year 6 cohort performed, you may be able to see gaps that surely suggest more about how they were taught than it was the same error across all 30 students. By digging deeper into the results, you may be able to create
- A focus on explaining inferences that will change outcomes one year later.
- Whole school literacy programmes that will change outcomes two years later.
- CPD to challenge the teaching of algebra that will change outcomes three years later.
We could go on but small steps could be found that could make a huge impact in your school.

The 1% Principle
The 1% Principle gives a clear and guided way for you to change your curriculum, focus in on all cohort groups and ultimately improve your outcomes over time. At its core, it is about the cumulative effect of incremental improvements – a journey of a thousand miles, but by one step at a time.
Remember, this does not have to be done in one go. The whole principle is based around lots of small changes that make a larger difference over a period of time. The key is integrating these insights into school improvement plans to ensure that the benefits are felt not just in individual classrooms but across the entire school.
But I don’t have the time or ability to do this…
This is possibly the main reason why most schools don’t use the results breakdown from the DfE. The results appear as numbers but don’t give you the detail you need to dive deeper. What you need is Question Level Analysis…
Question Level Analysis

Question Level Analysis (or QLA) has been described by some as a “magic bullet”. It breaks assessment data down into meaningful insight – looking instead at topics or cohorts rather than individual answers. This aggregation allows you to see patterns emerging which can be the drivers to implement change.
QLA is often used to look at the results of a mock exam. Here, the aggregated analysis gives clear guidance for teaching on topics where pupil didn’t perform well or individual intervention plans to help those who need more 1 to1 attention.
BUT why not use it backwards too… The same logic can apply.
By digging deep, could you find the “1%” to change your school?
But that sounds very Time Consuming?
That is where we come in..
DAISI Education are a team of expert analysts passionate about turning school data into meaningful insight so that your pupils can realise their potential.
In other words, our aim is to break your school data down into a way that allows you to find those marginal gains without spending hours staring at spreadsheets!
“After showing our Executive Headteacher the quality of the analysis you have provided, she has asked me to let you know how impressed we are with the analysis, including the speed we received it. We could never have achieved the same depth of analysis with the equivalent cost of staff time.“
Assistant Headteacher, Sheffield
QLA Results
Our QLA Results takes the raw data from the DfE – sent in to us by schools across the country – and aggregates it for you in a easy-to-read PDF report sent directly back to your inbox.
We don’t just give you numbers – we give you the tools for you to use to carry out your own deep dive. All your results are explained in plain English and shown through graphs and tables. Infact, Headteachers, Governors and School Improvement Advisors have all praised our reports as being “Accessible to all”, “Time saving” and “Outstanding Best Value!”.
Our Detailed Analysis includes..

A Full Summary
A clear starting point – focussing in on the headlines and points for you to focus on as the deeper analysis continues. For example, did you know that 85% of the total possible marks usually come from a small number of topics?

Topic Insight
We divide up the questions into bespoke Topics. Deep Dive into each subject to see where teaching could be improved and implement changes to your curriculum. Even small changes can significantly improve school results.

Type of Question
Is there one particular question type which is a problem to your pupils? Update your curriculum to include more practice and instruction in areas where pupils struggle or more challenge in areas where pupils excel.

Analysis of every Cohort
We break the results down into your various cohorts – gender, disadvantaged, SEN, EAL and more. Focus on different cohorts across your school to find areas where you can make changes that could make a substantial difference.

Individual Pupil Profiles
Our pupil profiles allow you to see where marks were lost and gained band provides detailed evidence to help guide your search for improvements across the school.

Does our Analysis Work?
There are many schools who have bought and used QLA Results over the past 12 years. Many of whom returned year after year wanting the analysis over and over again as they can see the benefits it has brought to their school improvement journey. You can read their feedback by clicking here.
Implementing the 1% principle in your school is all about making small, consistent changes that add up to big results. As mentioned before, the key is integrating these insights into school improvement plans to ensure that the benefits are felt not just in individual classrooms but across the entire school.
80% of schools who used DAISI QLA consistently over three years have seen an increase in their attainment. By embracing the 1% Principle, schools can create a culture of continuous improvement, where every small step contributes to significant, long-term success. These small changes can help create a more dynamic, supportive, and efficient school environment.
You can read about one in our Case Study – How QLA helped to improve our results.
“We find the Question Level Analysis from DAISI invaluable at Seely Primary and Nursery School. In my role as deputy headteacher of a big school as well as assessment coordinator, there is no way I would have the time or capacity to complete QLA to the level and in the detail that the DAISI team do. They saved me days of work and the information this gives me allows us to develop whole school targets that we can show improved the attainment of our pupils.”
Deputy Headteacher, Nottingham
“Thank you ever so much for the QLA reports & the subsequent updates. The service we have received from yourselves & the attention to detail have been fantastic. We have found the reports to be incredibly useful & they are helping us to shape our school improvement priorities for the coming year.”
Headteacher, Holy Trinity CE Junior School, Ripon
Thank you for this. We have always felt the DfE QLA could go further.
Hi Ben – Thank you for your comment. Do take a look here for more information of what our analysis adds to the DfE one… https://daisi.education/sats-results-analysis/
Sounds really useful – Will pass onto our headteacher.
Hi Louise – Thank you for your comment. Please do..
Thank you for this. We have looking at Question Level Analysis for a while now using the free ones from the DfE but always feeling it could go further. This explains what we’ve been thinking for a while…
Hi G – Thank you for your comment. Do take a look here for more information of what our analysis adds to the DfE one… https://daisi.education/sats-results-analysis/
Really interesting article especially after the KS2 SATs. Could make a real difference in October..
Hi E – Thank you for your comment. We agree obviously. Do take a look here for more information of what our analysis adds to the DfE one… https://daisi.education/sats-results-analysis/
We have used Question Level Analysis in the past for our mock sats and found it really useful. We have never used it for our actual results – but are interested to find out more..
Hi James – Thank you for your comment. We firmly believe in the power of QLA across many areas of school assessment. For a deeper look at what we mean – do have a look at this blog too… https://daisi.education/so-much-more/
Really interesting read – will certainly take a look.
Hi D – Thank you for your comment.