A Guide to Progress 8
This guide is designed to help alleviate the confusion between the different bandings.
It is also available as a video on our YouTube channel.
Progress 8 Bandings
In early 2017 the DfE categorised schools into 5 different Progress Bandings:
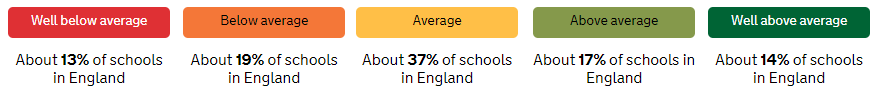
But it is easy to get things wrong.
BBC News website
The BBC News website did so on 16 April 2019, when it said:
A school’s performance is measured through pupils’ progress, called Progress 8, via a scoring system of between -1 and 1, with the average being 0.
A score lower than 0 is recognised as not achieving the minimum standard expected by the government, with -1 being well below average.
There are three things are wrong with these two sentences:
- Firstly, Progress 8 is not a scoring system of between -1 and 1. There are no such arbitrary limits, and in 2018 there are 70 mainstream schools with a Progress 8 score below -1, and 50 schools above +1.
- A score lower than 0 is not recognised as achieving the minimum standard expected; that would be -0.50 (but only up to 2017/18).
- A progress score of -1 is not the threshold of “well below average”, as implied by the above; that also is -0.50.
Progress 8 Bandings defined
So if the BBC News website got it wrong, how are these 5 Progress 8 Bandings defined?
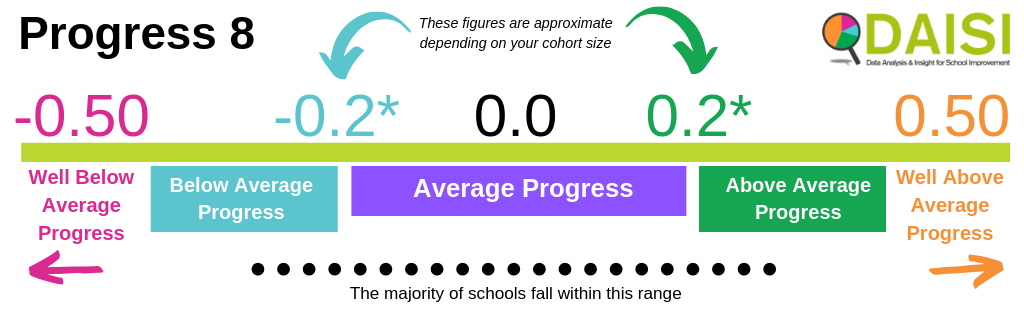
“Well below average” and “Well above average” are easy to define; they are a Progress 8 score of -0.50 or below, or +0.50 or above.
This threshold is slightly bigger for the 27 small secondary schools in England who have a cohort size of under 25 pupils.
For the remaining 3 Progress 8 bandings, technically it is all to do with confidence intervals. However, it’s a complicated explanation which can be simplified as follows:
It all depends on whether your Progress 8 score is beyond what can be described as a Progress 8 threshold. This threshold figure is solely dependent on the number of pupils in your Year 11 who have a Key Stage 2 Prior Attainment – in other words, those pupils who took the SATs 5 years earlier.
For secondary schools with a relevant Year 11 cohort size of 50 or above, the threshold figure is as follows:
| Relevant cohort size | Progress 8 Score Threshold |
| 50 | 0.35 |
| 75 | 0.29 |
| 100 | 0.25 |
| 125 | 0.22 |
| 150 | 0.20 |
| 170 | 0.19 |
| 190 | 0.18 |
| 210 | 0.17 |
| 240 | 0.16 |
| 270 | 0.15 |
| 310 | 0.14 |
| 360 | 0.13 |
| 420 | 0.12 |
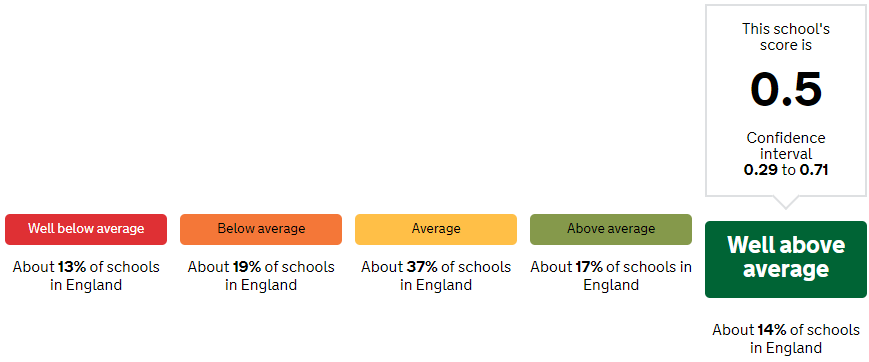
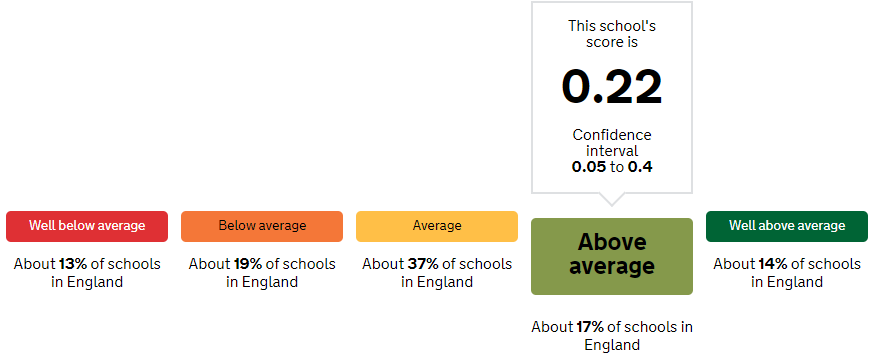
If your school’s Progress 8 score is higher than this figure, then your school is Above Average. In the below example, this school has a Confidence Threshold of 0.17, and this school beats that by 0.05.
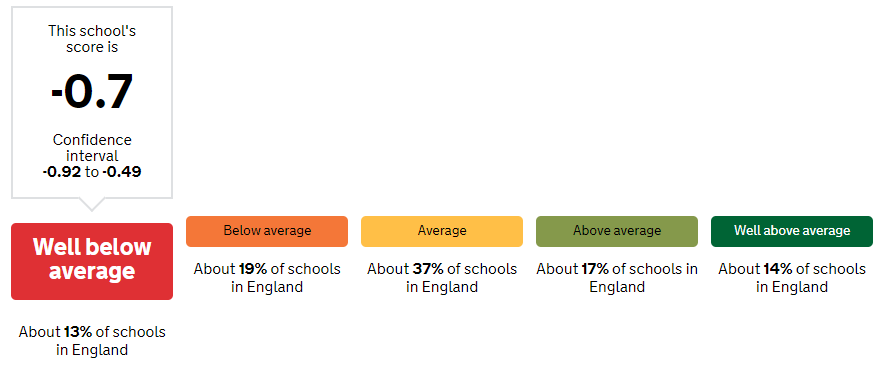
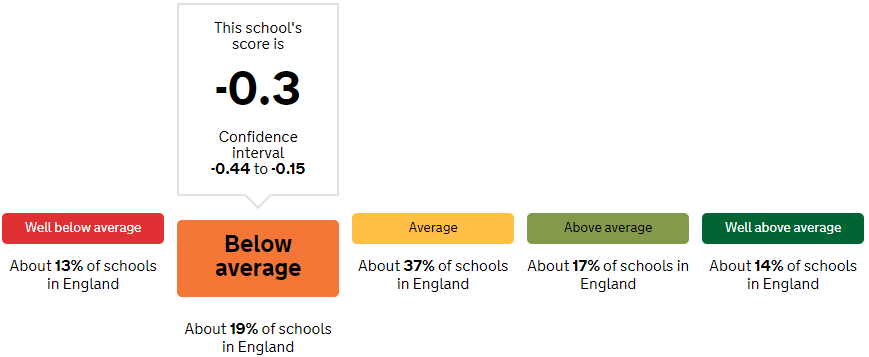
If your school’s Progress 8 score is lower than zero minus this figure, then your school is Below Average. In this example, this school has a Confidence Threshold of 0.15, and this school’s Progress 8 score is below that figure. It is also the case that if this school’s Progress 8 score improved to the Threshold of -0.15, this school would not be Below Average.
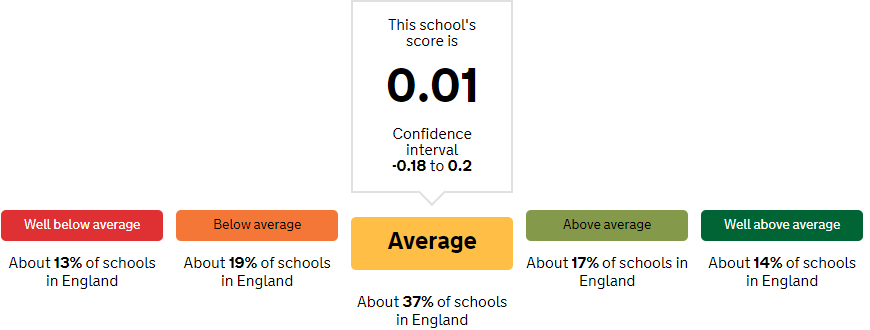
Any schools which are within the Confidence Threshold, both positive and negative, are “Average”.
You can also see this with the Confidence Interval, which is just your Progress 8 score minus the Confidence Threshold, and your Progress 8 score plus the Confidence Threshold:
- If both figures are negative, then your school is Below Average or Well below average.
- If both figures are positive, then your school is Above Average or Well above average.
- And if one figure is positive and one figure negative, then your school is “Average”.

We hope that this article is useful. Watch the video here.
Our School Data Guides are designed to help your understand how data works.
- KS4 GCSE and Equivalent (Y11)
- How is Attainment 8 calculated?
- How is Progress 8 calculated?
- Absence and Exclusion Figures
For more training articles and videos from DAISI Education – visit our Training homepage.
Really helpful. many thanks
Has made it so much clearer – thank you for the full KS4 guide too!