
What do you find in a DAISI QLA?
DAISI Education have been making Question Level Analysis since 2014, helping many schools find the marginal gains they needed to improve their results.
Our service delivers detailed insights into every question and topic, identifies patterns in question types, and tracks individual pupil performance. These insights support targeted interventions and inform classroom teaching plans, helping educators make data-driven decisions. Whether you opt for full-subject coverage (like our KS2 SATs Results or Mock Past Paper Analysis) or individual reports (Maths Assessments), our goal is to enable all pupils to achieve their potential through focused, effective preparation.
We provide full Analysis through detailed PDF Reports. With a full order, you will receive…
Comprehensive Overview | Forensic Subject Reports | Individual Pupil Profiles
Comprehensive Overview

Our analysis supports school leaders in taking a strategic, whole-school view —starting with headline outcomes such as how many pupils are meeting or approaching expected standards in Maths, Reading, and GPaS. From there, we delve deeper into the key topic strands within each subject, helping to uncover patterns, strengths, and areas requiring targeted support.
This layered approach enables schools to do more than just track attainment—it empowers leaders and teachers to make informed decisions about teaching, learning, and intervention. By identifying specific gaps in knowledge and skills, schools can develop precise next steps for pupils, adapt classroom planning, and refine curriculum delivery.
“I have just downloaded the Question Level Analysis. It’s BRILLIANT!!!! Really helpful! You have just saved me 15 fifteen hours of work. Thank you so much!”
Headteacher, Holy Trinity CE Junior School, Ripon
Forensic Subject Reports
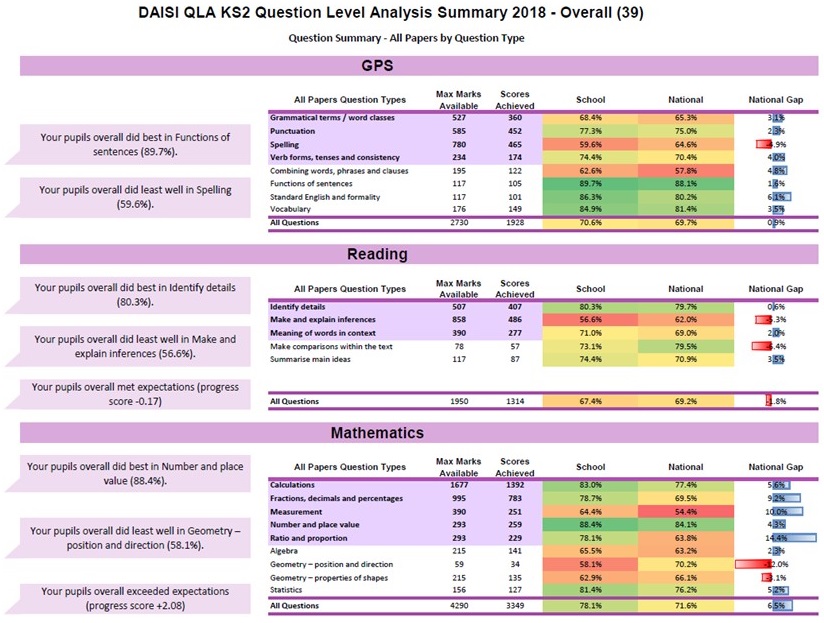
Our subject-specific analysis offers a deep dive into performance across Maths, Reading, and Grammar, Punctuation and Spelling (GPaS), helping schools uncover meaningful insights beyond the overall scores. This detailed examination enables teachers to tailor instruction, plan interventions, and track progress with precision—ensuring every pupil receives the support they need to succeed.
Deep Dive into each Subject with meaningful Insight by Summary , Topic , Question, and Cohort.
Summary
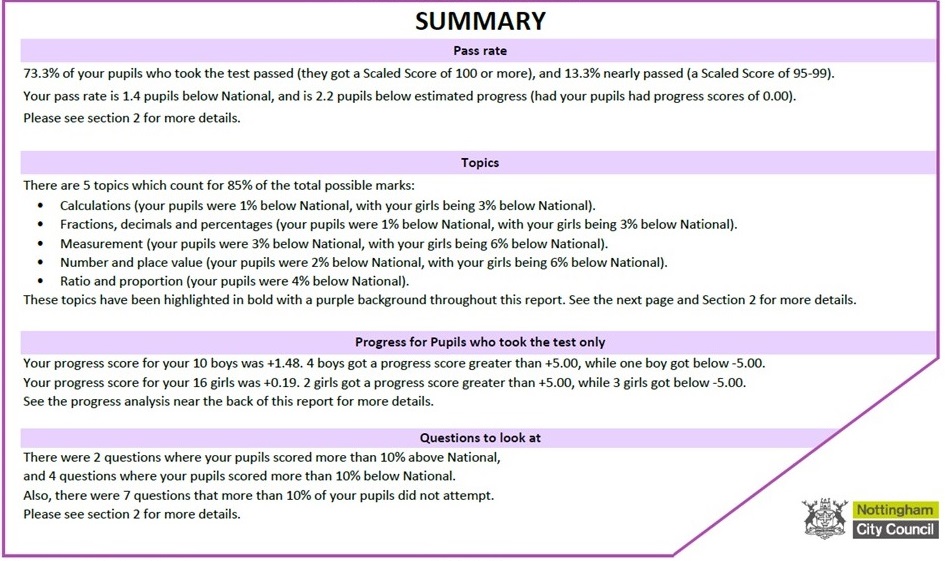
We always start with an overall view of assessment results (e.g., pass rates) and important topic strands to see how the school is performing. This helps produce clear next steps for pupils.
This analysis provides a clear starting point, focusing on key headlines and areas for deeper analysis.
“Thank you ever so much for the QLA reports & the subsequent updates. The service we have received from yourselves & the attention to detail have been fantastic. We have found the reports to be incredibly useful & they are helping us to shape our school improvement priorities for the coming year.”
Headteacher, Holy Trinity CE Junior School, Ripon
QLA Home | Summary | Topic | Question | Pupil | Cohort | Maths Assessments
Topic Insight
Question Level Analysis looking at topics or cohorts rather than individual answers. This aggregation allows you to see patterns emerging which can be the drivers to implement change.
Our Topic Insight enables teachers to create tailored lesson plans to address learning gaps on certain areas from the start of the year.
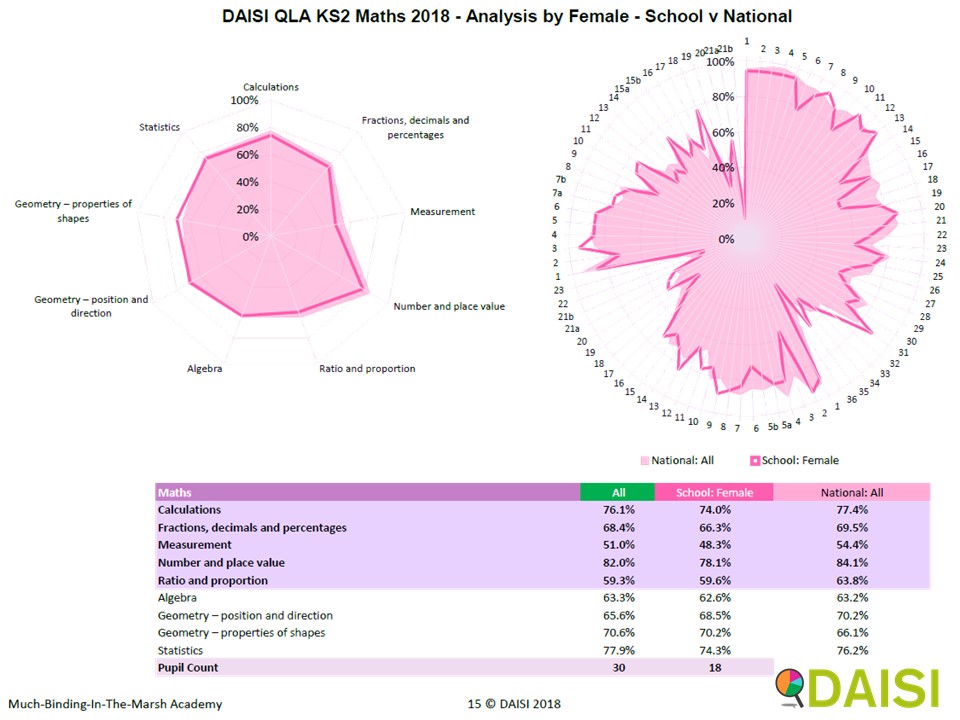
This page shows strengths and weaknesses for all pupils, comparing boys and girls, the entire year, and national averages. For example:
- Girls excelled in ‘Ratio and proportion,’ while boys did not.
- Boys performed well in the first four topics, whereas girls did not.
This analysis allows you to look at your subject as a whole to see what teaching could be improved and implement targeted interventions for groups that need additional support.
“I think they are a great tool and really help us to analyse our data in great detail. I have been telling everyone how good they are & how they have saved hours of work. This has allowed me to focus on how we can improve teaching and learning rather than spending time on the data analysis – a very welcome change.”
Headteacher, Captain Cook Primary School, Middlesbrough (James Cook Learning Trust)
QLA Home | Summary | Topic | Question | Pupil | Cohort | Maths Assessments
Question Analysis
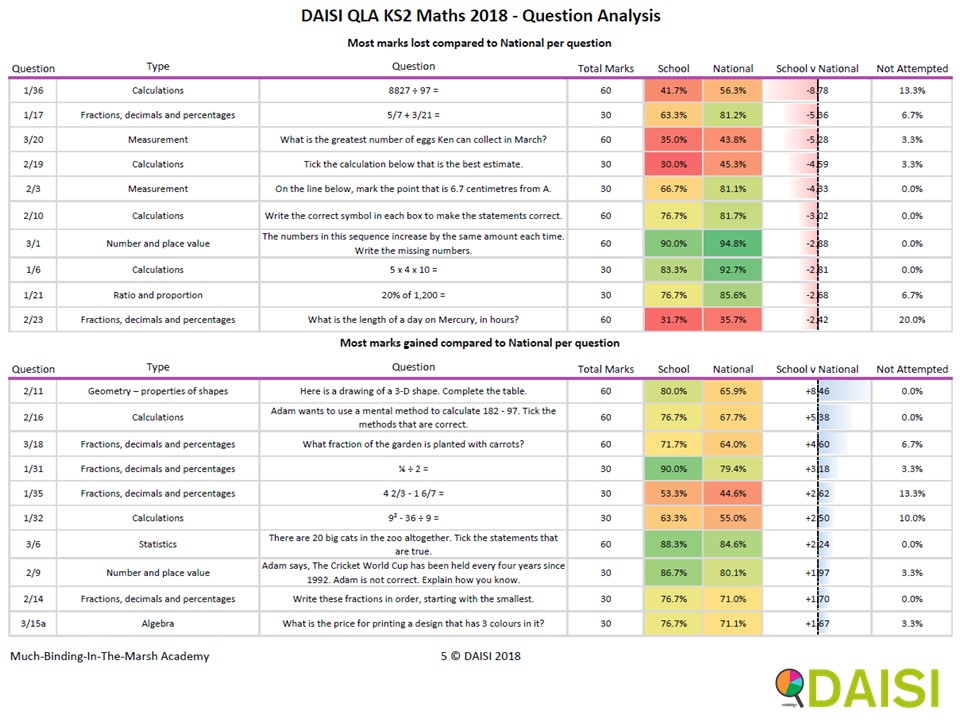
This analysis has been designed to help teachers identify questions that pupils found difficult or easier than average. For example, 8827 divided by 97 might be a common problem, highlighting issues with approximation.
It also shows areas where pupils outperform national averages, which can be extended for advanced students or allow time to focus on other topics.
This analysis can be used as evidence to update your curriculum to include more practice and instruction in areas where pupils struggle or indeed more advanced topics for areas where pupils excel.
“These reports are so thorough and useful. Subject leaders and Raising Standards Leaders in each primary school are going to be able to use this information to inform teaching and learning opportunities , not just in Year 6, but across the school. Some of the graphs used were new to me – it’s always good to be challenged by information presented in a different way!“
Headteacher, Ravensthorpe Primary School (Peterborough Keys Trust)
QLA Home | Summary | Topic | Question | Pupil | Cohort | Maths Assessments
Cohort Breakdown
For a full analysis of your results, you will need to look more than at your school overall or the overall score per pupil. By looking in detail at your various cohorts, you can see a more collective and forensic picture emerging. This is where the true power of QLA to change your school lies.
We break the results down in your various cohorts – gender, disadvantaged, SEN, EAL and prior attainment. This analysis is very powerful when looking back to find areas for school improvement.
For example, maybe when you look at your girls, you find that fractions are currently a problem, as evidenced by the results of certain questions compared with the National Average, and compared with your boys’ answers to the same question.
This analysis helps you focus on different cohorts within your year group and address areas in need. Small changes to specific cohorts can significantly improve school results. When these changes are embedded in school improvement planning, they can make a substantial difference.
“We struggled historically with reading results at the end of KS2 and have used DAISI QLA to drill down into the reasons why reading was significantly lower than maths. Using QLA we found that the issues were EAL pupils struggling with vocabulary -we introduced word of the week, then realising we needed more, word of the day. We also put on additional pre teaching sessions with an EAL teacher. We also identified that inference was a massive problem and we made it our whole school target, had loads of CPD and this made a massive difference.
In 2016, our reading EXP was 54%. In 2017, it was 68% and in 2018, it was 79%. All down to QLA.“
Deputy Headteacher, Seely Primary & Nursery School, Nottingham
QLA Home | Summary | Topic | Question | Pupil | Cohort | Maths Assessments
Individual Pupil Profiles
When preparing for exams, our Individual Pupil Profiles are the most powerful aspect of our QLA. Very simply and clearly, you can see each pupil’s strengths and challenges and be able to work with them to change this. By breaking down a test result into different areas, it enables the pupil to focus on these topics knowing the overall improvement will come.
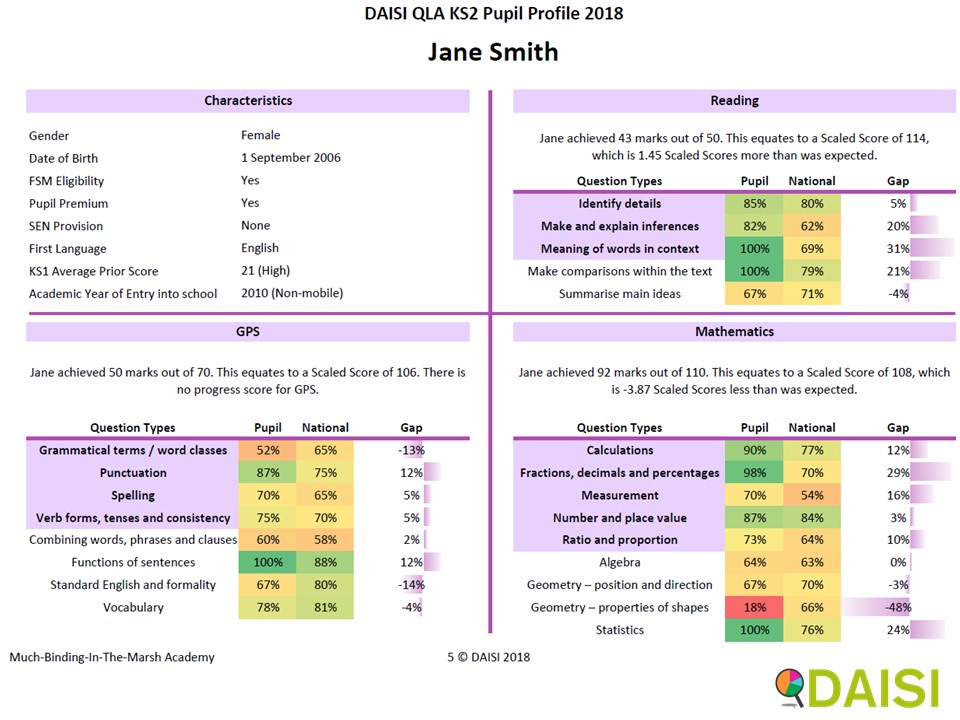
For example, Jane might be doing 12% better than the National Average for Punctuation, but is doing 13% below for Grammatical terms and word classes. With that knowledge, you might want to investigate why that is the case.
You can use the profiles to pinpoint specific challenges each pupil faces – providing additional resources or one-on-one tutoring – or indeed Incorporate activities that leverage pupils’ strengths to boost confidence and engagement.
This analysis is perfect for tutors and individual teaching assistants as they focus on the areas to aid catch-up or bespoke intervention.
“In regards to the QLA as we have such a large cohort – it is good to look for areas/types of questions where children have struggled and we need to focus on further in the future. The QLA for each individual child is useful when looking at specific children within groups SEN, FSM, PP looking particularly at their individual progress in each subject.”
Headteacher, Fernwood Primary School, Nottingham
QLA Home | Summary | Topic | Question | Pupil | Cohort | Maths Assessments
DAISI Education Question Level Analysis
There are many schools who have bought and used our analysis over the years. Many of whom returned year after year wanting the analysis over and over again. You can read their feedback by clicking here.
Looking back at an impact on results, we recently worked out that 80% of schools who used DAISI QLA consistently over three years have seen an increase in their attainment. We cannot take the credit for this as it is up to how the school uses the analysis provided but we know it clearly made a difference.
Click here to find out how we can help your school today
“Fantastic and so simple to use. In addition, it would have taken us an inordinate length of time to produce anything quite like it… Thank you! In Ofsted speak Outstanding Best Value!!!
Broadway Junior School, Sunderland
“After showing our Executive Headteacher the quality of the analysis you have provided, she has asked me to let you know how impressed we are with the analysis, including the speed we received it. We really appreciate the program you have developed to do this for our benefit. We could never have achieved the same depth of analysis with the equivalent cost of staff time.“
Assistant Headteacher,Gleadless Primary School, Sheffield
Thank you for reading this article. Find other Blog articles by clicking here
Check out more about how we can help your school: Primary | Secondary
DAISI reports are so thorough and useful. We have used them for many years. I am a massive fan of QLA and find it invaluable in my school.
Thank you for your comment – Rosemary. We totally agree.
Really useful guide to Question Level Analysis
Thank you
I find QLA really useful. It has helped with the bigger picture allowing me to really home in on specific groups, groups within groups and the specific areas which we need to address within our school
Thank you Natalie for taking the time to comment. We agree – QLA can really help with deep diving into your data and helping to find those marginal gains every school can find. https://daisi.education/marginalgains/
I like the pupil profiles – these could be really informative
Thanks Dawid – we agree. Many schools have got back in touch commenting on how helpful they are..
We have found the QLA to be incredibly useful in helping us to shape school improvement priorities. Would recommend..
Thank you James. Really glad you found them useful.